Skip Main Navigation
Office of Management and Budget
President's Budget
Management
Information &
Regulatory Affairs
Legislative Information
Agency Information
Click images to enlarge  
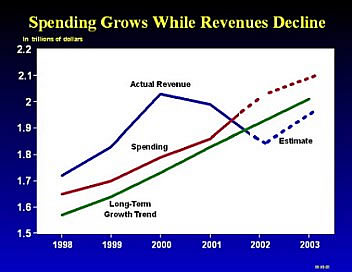
Chart, Spending Grows While Revenues Decline After surging for more than seven years, revenue growth slowed dramatically in 2001, even before accounting for the 2001 tax relief act. The stock market downturn begun in March 2000 and the recession that started in January 2001 explain most of the decline in revenues.
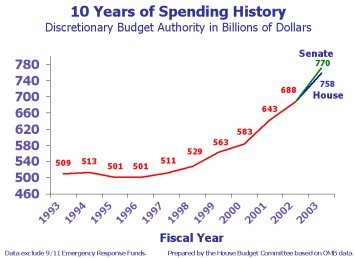
Chart, 10 Years of Spending History Steady discretionary spending levels prevailed during the first five years of the past decade. Since 1998, though, the climb in spending has been persistently steep.
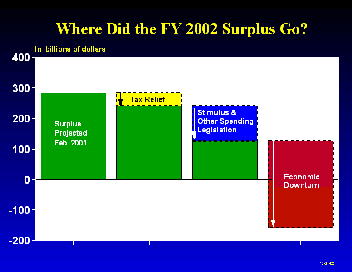
Chart, Where Did the Surplus Go?

The economic downturn stands out as the biggest factor causing the projected surplus to fade away.

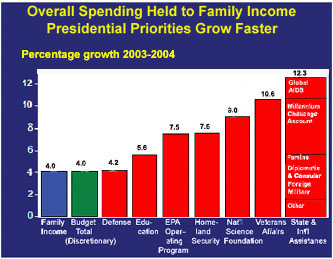
Overall Spending Held to Family Income Presidential Priorities Grow Faster


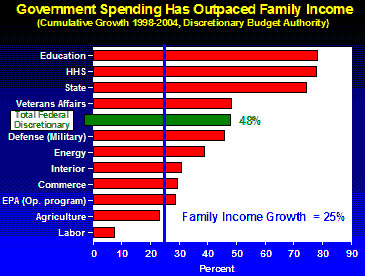
Over the last five years, spending growth at most major federal agencies, and by the U.S. government overall, has far exceeded the rise in median household income (depicted by the vertical blue line).
Government Spending Has Outpaced Family Income
The 48% rate of growth in federal spending over the last six years is almost two times the 25% growth of family income. At certain major departments, growth has run two to three times higher than that of typical family income.