
- Afghanistan
- Africa
- Budget Management
- Defense
- Economy
- Education
- Energy
- Environment
- Global Diplomacy
- Health Care
- Homeland Security
- Immigration
- International Trade
- Iraq
- Judicial Nominations
- Middle East
- National Security
- Veterans
- President's Cabinet
- USA Freedom Corps
- Faith-Based & Community Initiatives
- Office of Management and Budget
- National Security Council
- USA.gov
|
Home >
Government >
Council of Economic Advisers
|
Council of Economic Advisors
Testimony of Edward P. Lazear
Chairman, Council of Economic Advisers
Before the Senate Budget Committee
“State of the Economy and the Budget”
September 28, 2006
![]() Full PDF Document (51.7K)
Full PDF Document (51.7K)
Chairman Gregg, Ranking Member Conrad and Members of the Senate Budget Committee, good morning, and thank you for giving me the opportunity to speak to you about the economy and its relation to tax revenues and the budget.
Our goal is to create a positive economic climate so that good jobs are plentiful and workers’ paychecks grow. I believe the best way to maximize economic growth is to keep the tax burden on families and entrepreneurs low, expand markets for American goods and services, and pursue other pro-growth policies that unleash innovation and creativity. Economic growth has benefits for the federal budget, too. The substantial revenue growth from our strong economy has helped shrink the deficit for two years in a row.
I’d like to begin by summarizing the economy—where we are right now, and where I believe we are headed. Real growth of Gross Domestic Product (GDP) was 3.1 percent over the four quarters of 2005. Although it now appears that GDP growth in the current quarter will be significantly slower than in the first half of the year, the current forecast indicates that growth in 2006 will remain about the same as growth last year, and the economy should continue to grow at a robust pace in 2007 and beyond.
Job growth has been strong. The economy has been producing roughly 1-1/2 to 2 million jobs per year for a total of 5.7 million additional payroll jobs since August 2003. We expect that trend to continue with some slight moderation. The unemployment rate, which was 5.1 percent in 2005, is expected to average 4.7 percent for 2006. The most recently released jobs report showed the unemployment rate declining to 4.7 percent—the forecast for this year—and additionally it revealed an increase of 128,000 payroll jobs during the month of August. This continued increase in payroll jobs even in an environment with low unemployment rates suggests that the labor market continues to be strong and that its tightness will be reflected in more wage growth as we move into the coming months.
Nominal wage growth has accelerated over the past year, and at an annualized rate has been 4.1 percent since January 2006. As I will discuss shortly, this follows the typical business cycle pattern of productivity increasing, leading to wage increases though with a lag.
What distinguishes this period from the past is that recent large and unanticipated increases in energy prices have consumed much of the strong nominal wage growth. Workers’ paychecks have gone up, but they have had to use a portion of that increase for higher costs of energy such as gasoline and heating fuel. The increase in the price of gasoline and oil products has been one of the most notable changes in our economy during the past year. The period from August of 2005 until August of 2006 witnessed a 22 percent increase in the price of crude oil, and a 32 percent rise in the price of gasoline. High energy prices strain family and business budgets, but throughout this period the economy exhibited resiliency and continued to grow at a rapid pace. Indeed, real growth for the first half of this year averaged about 4 percent on an annualized basis.
Since the beginning of August, we have experienced substantial declines in the price of gasoline and crude oil. Gasoline prices have dropped 21 percent since early August, and the price of crude oil has gone from a high of $77 per barrel down to $61 now. This is positive news for two reasons. First, it suggests that inflation rates will moderate as we move forward, and so high nominal wage growth such as we have seen in the recent past will translate into real additional buying power for the typical American worker. Second, lower energy prices are a positive force in growing the economy.
The decline in energy prices is already apparent in the very latest inflation data. Markets are expecting inflation rates going forward to moderate to around 2.5 percent. Nominal wage growth of 4.1 percent such as what we saw over the first half of this year, would then translate into increased real earnings for the typical worker.
All of this has implications for the budget. In its Mid-Session Review released last July, the Office of Management and Budget confirmed that strong economic growth is helping to increase Federal revenues and is reducing the budget deficit more quickly than expected. The President’s goal of cutting the deficit in half by 2009, which drew the scoffs of many, is now likely to be reached before that date.
A soft spot in the economy is the housing market. We are now experiencing an anticipated slowdown in residential construction and in the pace of housing price increases, and it appears that the housing slowdown will be a significant drag on third quarter growth. It is important to note, however, that the weakness in the housing sector does not seem to be spreading to other sectors of the economy, that other areas of the economy that have not shown much vibrancy, such as non-residential construction are now picking up, and that recent consumer surveys indicate improving expectations.
In sum, we expect the average growth rate for this year to be similar to that for last year. Our economy continues to be robust and healthy.
Productivity
Underlying these strong numbers is high productivity growth that has made our economy the strongest and most robust in the world. It is the common thread that ties all of the positive economic news together.
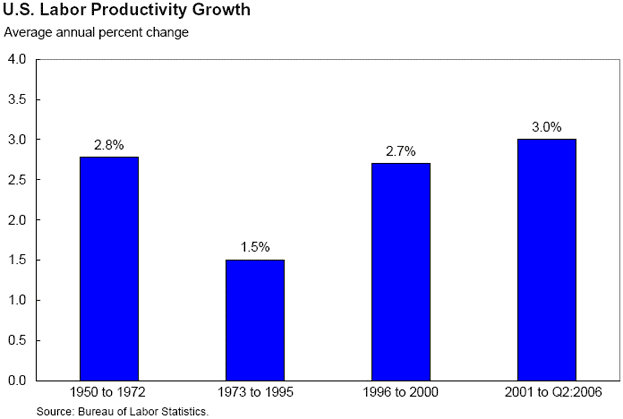
Figure 1
Figure 1 puts our recent productivity growth in historical perspective. The Bureau of Labor Statistics reports that U.S. productivity growth since the end of 2000 has been 3 percent per year, outpacing the 2.7 percent average from 1996 to 2000. The current growth rate in productivity is substantially above that for the 22-year period that preceded 1995, when productivity growth averaged only 1.5 percent per year.
American productivity growth results from many factors, but the most likely candidates that account for the difference between our high productivity growth and the slower productivity growth of many other industrialized nations include labor market flexibility, high levels of investment in both physical and human capital, low taxes, and a culture of entrepreneurship – coupled with high levels of business formation.
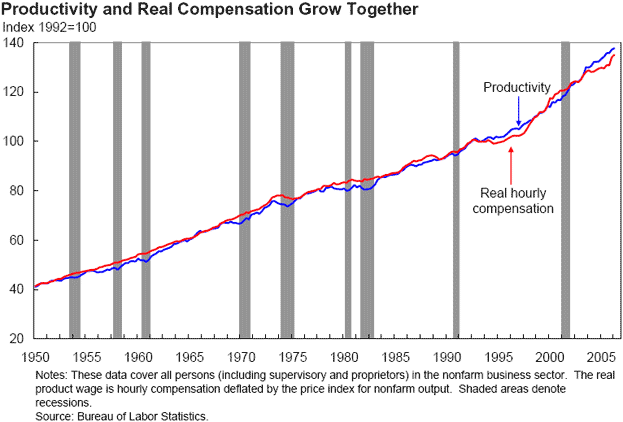
Figure 2
Productivity growth is important because it leads to higher living standards and is a key measure of our international competitiveness. Employee compensation tracks the closest with productivity. Compensation is the combination of both benefits and wages.
Figure 2 shows the very strong correlation between productivity increases and improvements in real hourly compensation. The red line and blue line move together over any reasonable period of time. Although there are periods during which the two series diverge, they tend to catch up to one another. In particular, hourly compensation growth sometimes lags productivity growth—especially as the economy comes out of a recession and moves into a recovery. That was the case in the early 1990s. If you examine the chart, you will see that the red line, indicating hourly compensation, falls below the blue line, indicating productivity, for the period during the mid-90s. During the late part of the 90s, the red line rises at a more rapid rate than the blue line so that hourly compensation growth overtakes productivity growth.
The mild recession that occurred at the beginning of this decade was followed by strong productivity growth as shown earlier. But as in the mid-90s, hourly compensation growth has lagged behind. More recently, however, hourly compensation growth has started to pick up, and if these trends continue, the remainder of 2006 will enjoy real hourly compensation gains and will put us on a path toward catching up with earlier productivity increases.
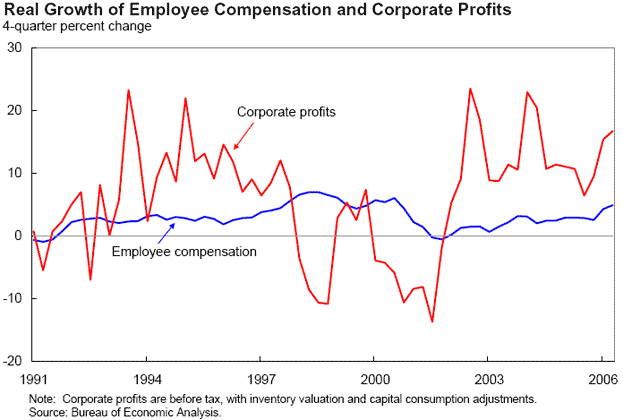
Figure 3
Productivity, Profits, and Compensation
A number of observers have pointed out that profits have grown at a very high rate during this recovery, which is reflected in Figure 3. The red line, showing profits, grew at a high rate over the past three years.
Two additional points are apparent from looking at Figure 3. First, corporate profits are more volatile than employee compensation. The red line jumps around to a much greater degree than does the blue line, and the extremes are significantly more pronounced. Indeed, the four-quarter growth rate in profits was over 20 percent in the third quarter of 1993, the first quarter of 1995, the fourth quarter of 2002, and the second quarter of 2004.
Second, there is a distinct pattern of profits and labor compensation over the business cycle. After the recession in the early 1990s, corporate profits rose dramatically and employee compensation lagged behind. At the same time, productivity grew faster than compensation, as we saw earlier in Figure 2. Profit growth outpaced compensation growth until the latter part of the 1990s when corporate profits fell dramatically. Note corporate profits declined throughout most of the period between early 1998 and late 2001.
Just as in the 1990s, the mild recession in 2001 was followed by productivity growth in 2002 and profit growth was again very high, while employee compensation growth was relatively low. The pattern that we observed in the past two recessions and recoveries is evident in earlier recessions as well, going back at least 40 years.
The pattern typically works in the following way. After a recession, productivity growth increases and hourly compensation tends to remain flat. As a result, costs stay low and profits rise. As the labor market gets tight, unemployment rates fall, hourly compensation increases faster than productivity growth and so total costs rise faster than earnings. The result is that as labor costs go up faster the profit rate then declines to more normal levels.
Profits are important because they provide the incentive for investment in physical capital, and physical capital growth contributes to productivity growth. With rising compensation, we forecast that profits rates will decline in the future, but that this decline will bring them back to normal levels and so profit rates will be sufficient to motivate the high levels of investment necessary to grow our economy. Whether real compensation growth will rise to the rates that we have seen over the previous expansions remains to be seen. But early indications are that we are on a similar path.
Tax Cuts, Economic Growth, and the Budget
The tax cuts passed the Congress and signed into law by President Bush have helped the economy grow. Probably most significant was the cut in dividends and capital gains taxes enacted in 2003. However, the lowering of marginal tax rates on labor income was also an important contribution to economic growth.
Lower tax rates enable workers to keep more of their earnings, stimulating work effort and labor force participation. Lower tax rates also encourage greater innovation, entrepreneurial activity, and small business formation. Lowering the tax rate on capital income has encouraged greater investment, which is seen as the main driver of economic growth. For example, there is preliminary evidence that the 2003 reduction in capital income taxes stimulated investment. In the nine quarters prior to the mid-2003 tax cuts, private non-residential investment fell at an average rate of 6.7 percent. In the 12 quarters since the cut, private non-residential investment has grown at an average rate of 6.1 percent.
Government revenues tend to move directly with the state of the economy. When the economy is strong, revenues tend to come in at high rates, and when the economy declines, revenues tend to decline correspondingly. The period since 2003, which has seen a growing economy, has also been one during which government revenues have increased at high rates. Since 2003, government revenues are up 34.6 percent, and the projected growth of revenues from 2005 to 2006 is around 11 percent.
Because of this rapid economic growth – together with the continued efforts of Congress and the President to effect discretionary spending restraint – the budget deficit is declining at rates much faster than was anticipated, and we are on the path to meeting the President’s deficit goal ahead of schedule.
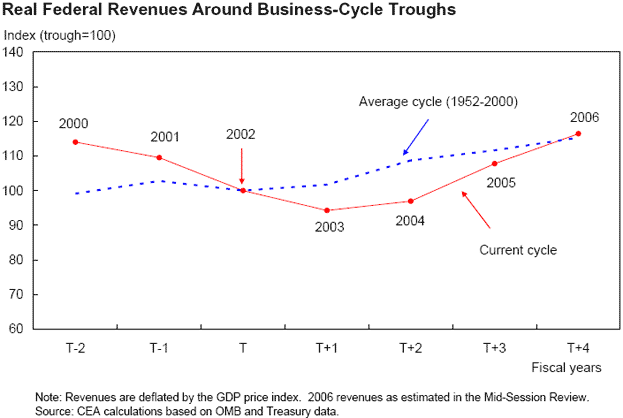
Figure 4
To determine the effect of tax cuts on revenue, we need to ask, “What would revenues have been absent these cuts?” This question can be answered by providing estimates of what revenue would have been had we not cut taxes. An exercise of this sort can be conducted in a number of different ways, and we recognize the inherent uncertainty associated with the calculations. In Figure 4, we provide a simple comparison using historical data, and show the path of revenue growth in this business cycle compared with previous cycles.
We index real revenues for each of the eight previous business-cycle troughs (from 1952 through 2000) so that they equal 100 in the year of the trough. The dotted blue line in Figure 4 shows the average of these cycles. The horizontal axis denotes time, and the year labeled “T” is the trough of the recession. The figure shows that revenues tend to decline as the economy moves from the year before the trough into the trough, and then tend to increase the year after. The blue dotted line goes down from T minus one to T and then rises from T to T plus one.
The solid red line shows what happened during the current cycle’s recovery (similarly indexed, with a trough in fiscal year 2002) compared with previous recoveries. With the tax cuts that were enacted in 2003, receipts were below the average of previous recoveries. These lower revenues persisted through 2005. But more important than the levels is the growth rate. Because of the growing economy (which we believe was stimulated at least in part by the tax cuts) and growing taxable income, preliminary data suggests that revenues grew between 2004 and 2006 at rates higher than were experienced in earlier recoveries. More refined estimates will be possible when tax return information for 2006 becomes available.
Will the tax cuts pay for themselves? As a general rule, we do not think tax cuts pay for themselves. Certainly, the data presented above do not support this claim. Tax revenues in 2006 appear to have recovered to the level seen at this point in previous business cycles, but this does not make up for the lost revenue during 2003, 2004, and 2005. The tax cuts were a positive step and have contributed to the enhanced economic growth, additional jobs, higher real disposable income, and the low unemployment rates that we currently see today. Our goal is not to maximize the size of government, but to provide revenues to make sure that we can operate those programs that society deems necessary, while at the same time allowing the private sector to take full advantage of its growth potential.
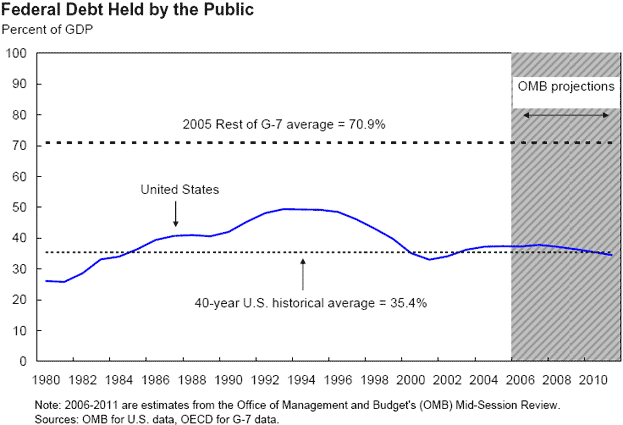
Figure 5
It is also worth noting that because our revenues are growing at such high rates right now relative to spending, the ratio of the publicly-held debt to GDP, which most economists view as the best indicator of the sustainability of our current budget situation, is expected to decline this year.
Not only is our debt-to-GDP ratio improving as a result of our high economic growth and enhanced revenues, but it is very close to our 40-year historical average, and lower than at any point in the 1990s. As a result, our debt situation is favorable relative to both its past and to the debt situation of other major industrialized countries (Figure 5).
This should not be taken as a reason to be complacent. Indeed the opposite is true. If we do not control our spending, both on the discretionary and entitlement sides of the budget, the pattern that we are seeing in the current year could easily reverse, and we could find ourselves in a debt situation that requires higher and higher interest payments relative to our GDP in the future. This is not a burden that we want to pass on to our children and grandchildren.
The Future
Where do we go from here? I believe it is important to maintain a positive economic climate so that the labor market will remain strong, workers can find jobs quickly, and so that, coupled with declining energy prices, the typical worker paycheck will buy more and more goods and services. The best way to do this is to continue our pro-growth tax agenda, to remain open to international trade and capital flows, and to keep our economy among the most flexible in the world.
Thank you for giving me the opportunity to speak to you today, and I welcome your questions.


